When the project grows bigger and more complex, it’s really inconvenient and expendable to prepare all configurations in a local machine. It will be more natural and efficient to debug the application in the remote dev environment directly.
This tutorial will show you how to build a remote debug environment with Visual Studio Code and solve some problems I suffered.
Prerequisites
- Golang
- Visual Studio Code
- Delve
- ssh
- The remote host (Your dev environment)
Install Delve
Delve is a simple, full-featured debugging tool for Go. Run the following command to install Delve on the remote host.
go get github.com/go-delve/delve/cmd/dlvNow we need to debug the remote application to control the debugging process through VS Code. VS Code Golang plugin will connect to the remote debugging server and send all Delve commands to the server for debugging. If you encounter problems with installation, please refer to the golang installation document. You can find multiple systems installation tutorial.
Launch Remote Application
We login to the remote host through ssh as usual. Then compile our applications with the following flag to allow Delve to collect advanced debugging information:
-gcflags "all=-N -l"Then launch our application and find the process id of the application. If you use docker too, you can find the application process id like this:
docker inspect -f '{{.State.Pid}}' <container id>Or, you can use the commandpgrep <process name> to retrieve the id no matter the way you launching applications.
Use Delve to Start Debugging Server
We’ll use a debugging client in the local machine through the VS Code. So, we need to start the debugging server in the remote host using theheadless option.
dlv attach <pid> --listen=:2345 --headless --api-version=2 --logYou can see the message like the following if successful:

You can also use the command lsof -i:2345 to check the debugging server:

If you encounter the following error:
dlv attach error: could not attach to pid Xxx, could not open debug infoIt means that debug symbols are stripped out of your executable file. You can read the sections’ header to confirm that like following:
readelf -S {executable_file}If the output doesn't include debug symbols like the followings:

Check your build command. In my experience, I used the-s option in the ldflags linker flag. This flag stripped all the symbol tables, including debug symbols.
Use Ctrl + C should stop the debugging server. However, there is a bug here. We can use pgrep dlv and kill -9 <pid> as a substitute.
Prepare Debugging Client
Now we come back to our local machine. Open our project in VS Code and ensure the same branch with the remote host.
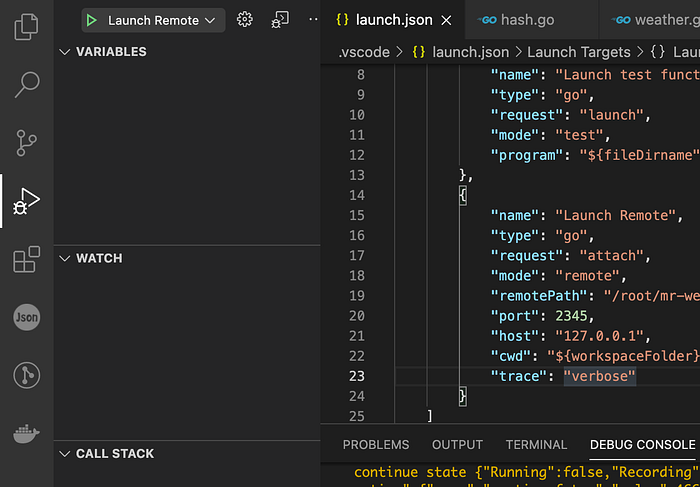
Open launch.json in VS Code.
{
    "name": "Launch Remote",
    "type": "go",
    "request": "attach"
    "mode": "remote",
    "remotePath": "{remote path}",
    "port": 2345,
    "host": "{host}",
    "cwd": "${workspaceFolder}",
    "trace": "verbose"
}
Add a configuration like above. The remotePath means the project root path in the remote host. Go to your remote host and cd to your project, then run pwd , the result is the value of remotePath here.
We can see detailed messages with"trace": "verbose" configuration in Debug Console.
Pay attention to the host . If you can connect to your remote host directly, then use your host address. In my case, I can only use ssh to access my remote host. So, I need to use ssh local forwarding to access to debug server.
ssh -L 127.0.0.1:2345:localhost:2345 <remote host ip> -NStart Debugging Client

Open Debug Extension in VS Code and run Launch Remote. You’ll see an overlay control panel in the VS Code like the following:

Now we can add breakpoints and control debugging steps through the VS Code.
Unverified Breakpoints
I suffered from this problem by adding breakpoints for the whole day. I checked my configurations, again and again. However, I didn’t find any problem. I always saw the following message at the Debug Console.
Error on CreateBreakpoint: could not find file /xxx/xxx/xxx.goBut I could find the file on the remote host. Finally, I checked my debug build command, and I found the flag trimpath . This flag will remove all file system paths from the resulting executable. So this is the reason why the debugging server cannot find the file. I removed this flag in the debug build solved the problem.
I hope this helps. Let me know if there are any mistakes or if an update outdated in the future.
